Hotcoin Research | Bitcoin Surges Past $120,000 — Is Altcoin Season Truly Here?

I. Introduction
On July 14, Bitcoin surged past the $120,000 mark, setting a new all-time high, while altcoins rallied broadly in a long-awaited breakout. This sharp market shift has reignited debate: has “altcoin season” truly begun?
With rising expectations of Fed rate cuts, easing macro conditions, and continued institutional inflows into Bitcoin and Ethereum, market risk appetite is clearly on the rise. However, Bitcoin dominance remains high, the ETH/BTC ratio has yet to break key resistance, and capital flows suggest selective rather than widespread rotation.
Is this the start of a sustained altcoin cycle — or just a short-term, capital-driven surge?
This report breaks down the landscape across multiple dimensions: macro trends, institutional positioning, capital rotation, on-chain activity, ecosystem traction, and market sentiment. Through clear data interpretation and sharp analysis, we aim to help investors navigate this evolving environment — spotting real opportunities while staying alert to emerging risks.
II. Macro Analysis
1. Macro Environment Turns More Accommodative
Global macro conditions continue to shift toward easing, driven by several key developments.
The Federal Reserve’s stance is growing more dovish. Minutes from the July meeting revealed increasing internal divisions, with Waller supporting a July rate cut and Bowman backing early easing — though most officials remain cautious. Fed funds futures now price in a 65% probability of a cut by September, a notable jump from prior forecasts. The Fed’s projections are unusually split: 12 members see 50 basis points of cuts in 2025, while 7 anticipate 100 bps. A more accommodative environment tends to support crypto valuations, and given current elevated rates, any dovish signal could rapidly amplify Bitcoin’s upside momentum.
Global trade tensions have eased, further strengthening the macro backdrop for crypto. Geopolitical risks have also moderated, with markets showing reduced sensitivity to external shocks.
In the U.S., regulatory clarity is improving. Positive signals include leadership changes at the SEC, progress on stablecoin regulation (GENIUS Act), the proposal of Bitcoin strategic reserves, and a new digital asset policy framework from the White House — all contributing to a more stable and investor-friendly environment.
2. Persistent Institutional Inflows
Sustained institutional inflows remain a key force behind crypto’s current strength. While Bitcoin and Ethereum remain the primary focus, capital is steadily expanding into other major Layer-1 assets.
On July 16, spot Bitcoin ETFs recorded net inflows of $799.5 million — marking the 10th consecutive day of positive flows and pushing total assets to $148.84 billion. Spot Ethereum ETFs also saw strong inflows, with $716.63 million added and a 9-day streak, bringing total assets to $13.25 billion.
Although Ethereum’s year-to-date price growth still lags behind Bitcoin, institutions are rapidly increasing ETH allocations via ETFs. As ETH reclaims the $3,000 mark, this growing “ETF reservoir effect” is not only boosting confidence in Ethereum but also reigniting interest across the altcoin landscape.

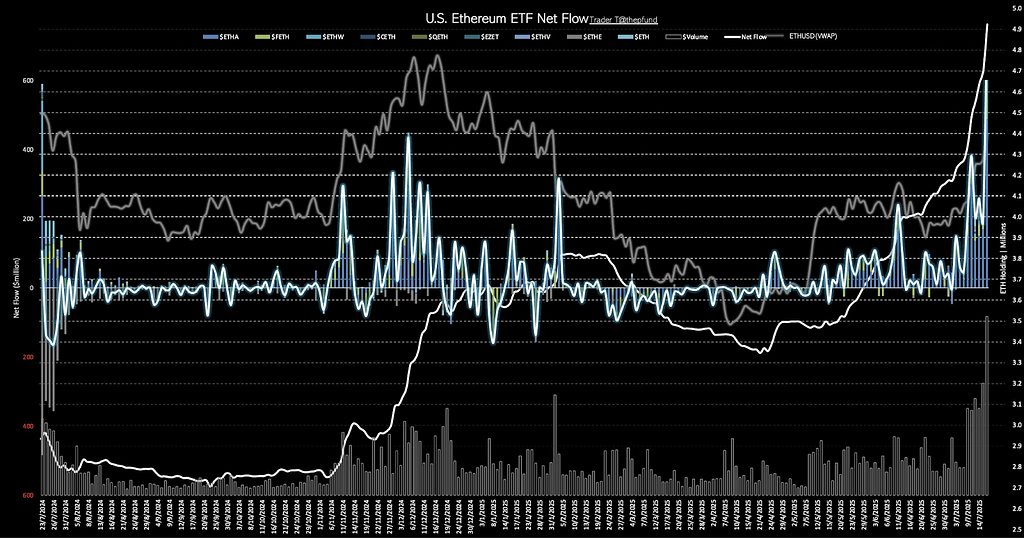
Source: https://x.com/thepfund
Institutional capital is steadily moving beyond Bitcoin and Ethereum, signaling rising confidence in leading alternative Layer-1s.
VanEck and Bitwise have filed for spot Solana ETFs with the SEC, while Grayscale has expanded its offerings with multi-altcoin trust products. On July 15, U.S. asset manager ProShares launched 2x leveraged futures ETFs for Solana (SLON) and XRP (UXRP), now trading on NYSE Arca — highlighting growing institutional demand and infrastructure for top altcoins.
Public companies are also beginning to diversify their crypto holdings. SharpLink Gaming (NASDAQ: SBET) disclosed holdings of 296,508 ETH (worth ~$997 million), surpassing the Ethereum Foundation to become the largest ETH-holding public company — earning it the nickname “the MicroStrategy of Ethereum.” The number of institutions holding over 100,000 ETH has now reached seven, including SharpLink, the Ethereum Foundation, PulseChain Sac, Bitmine Immersion, Coinbase, Golem Foundation, and Bit Digital.
Solana is seeing similar trends. DeFi Development Corp — dubbed the “Solana MicroStrategy” — now holds 640,585 SOL and related assets valued at $98.1 million.
Meanwhile, SRM Entertainment is rebranding as Tron Inc, with a stock symbol change from “SRM” to “TRON” effective July 17. Tron has announced a reverse merger to go public and launch its TRX strategic reserves, with all SRM TRX now staked for yield.
III. Capital Flows and Asset Rotation Analysis
1. Bitcoin Dominance
Bitcoin dominance — BTC’s share of total crypto market cap — remains a key indicator of market rotation. A peak and reversal in this metric is a classic signal that altcoin season may be underway.
On July 14, as BTC surged past $120,000, dominance dipped slightly to 62.88%. While this marks a minor shift, the level remains historically elevated. High dominance suggests Bitcoin is still absorbing most new capital, with altcoins yet to gain full traction.
For a true altcoin season to emerge, a more decisive decline in BTC dominance is typically needed — signaling broader capital rotation into smaller-cap assets.

Source: https://www.tradingview.com/symbols/BTC.D
2. ETH/BTC Ratio
The ETH/BTC ratio — Ethereum’s performance relative to Bitcoin — is widely seen as a leading indicator for altcoin capital flows. A rising ratio often signals growing investor appetite for risk and a shift of capital from Bitcoin into Ethereum and, eventually, the broader altcoin market.
Currently, the ratio is in a clear uptrend, recovering from a Q1 low of 0.017 to 0.029. Analysts note that a sustained breakout above the key 0.03 level could mark a turning point, confirming a broader rotation into Ethereum and altcoins, and potentially triggering a renewed altcoin rally.

Source: https://www.tradingview.com/symbols/ETHBTC/
3. Altcoin Season Index
The Altcoin Season Index gauges whether non-BTC assets have outperformed Bitcoin over the past 90 days. Based on CoinMarketCap’s methodology, an “altcoin season” is declared when at least 75% of the top 100 cryptocurrencies (excluding stablecoins) outperform BTC. If fewer than 25% do, it’s considered a “Bitcoin season.”
As of this week, the index has climbed from a mid-June low of 15 to 39, with nearly 40% of top altcoins now outperforming Bitcoin. While this doesn’t yet confirm a full altcoin season, it signals a clear uptick in altcoin momentum and investor interest.

Source: https://www.coinglass.com/pro/i/alt-coin-season
4. Altcoin Market Share and Trading Volume
According to CoinGecko, 24-hour crypto trading volume stands at $243.7 billion. Bitcoin accounts for 21%, Ethereum for 17.5%, and altcoins make up the remaining 61.5% — marking a notable rise in altcoin activity.
This shift follows Ethereum’s sharp rebound and renewed interest in undervalued major altcoins. However, the rally remains selective. Rather than fueling a broad-based surge, capital is flowing into emerging themes and high-conviction “blue chips,” highlighting a more strategic and targeted rotation across the market.
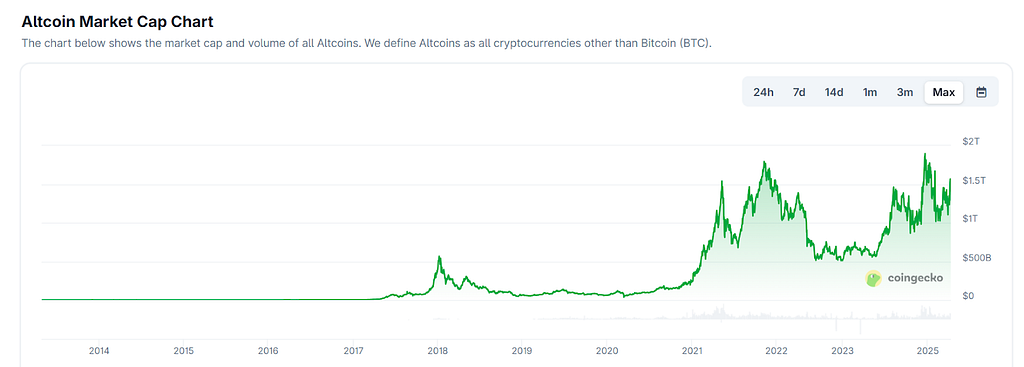
Source: https://www.coingecko.com/en/global-charts
IV. On-Chain Activity & Ecosystem Recovery Analysis
1. On-Chain Activity
On-chain usage metrics — daily active addresses, transaction count, gas fees, and more — help gauge real network demand and user participation. Recent data shows a meaningful rebound.
Ethereum reclaimed the #1 spot in June gas fee revenue, while Solana continued to dominate in raw activity, recording over 29.7 billion transactions in June and averaging approximately 4.8 million daily active addresses — well ahead of both Ethereum and Bitcoin.
As of July 17, 2025, Ethereum was seeing roughly 510,000 daily active ERC‑20 addresses, up around 50.8% year-over-year. This points to growing user engagement and application activity on the network. Broader DApp usage is also rising, with daily unique active wallets (dUAW) reaching approximately 25 million, up 8% month-over-month.
Meanwhile, DeFi total value locked (TVL) and NFT trading volumes have increased by around 25% and 40%, respectively — reflecting a wider uptick in on-chain engagement from both capital and end users.
Together, these trends are building the activity foundation that could support a broader rotation into altcoins.
2. DeFi Total Value Locked (TVL)
DeFi TVL is turning higher. Ethereum’s rebound (+40%) helped pull many protocols sharply higher, with blue chips such as Aave posting ~20% month-over-month TVL gains. Lido, EigenLayer, and other staking-linked protocols remain large in absolute terms despite volatility.
On the scaling front, Base is breaking out: 292 million cumulative transactions in June and approximately 1.71 million average daily active addresses highlight rapid adoption. Arbitrum (ARB) and Optimism (OP) — the two leading Ethereum Layer-2s — remain narrative leaders; while ARB is still below last year’s highs, renewed DeFi activity on these networks is drawing liquidity.
Chainlink (LINK) is benefiting from revived oracle demand and data infrastructure positioning. Aptos (APT) community engagement has accelerated, with price recovering to about $5.90 — another sign that liquidity is rotating back into higher-beta ecosystems.
By July 17, aggregate DeFi TVL had climbed from ~$89B to roughly $132B, with emerging structured-yield and new-finance protocols attracting incremental capital.

Source: https://www.coingecko.com/en/global-charts
V. Market Sentiment & Attention Indicators
Market sentiment often leads — or at least accompanies — capital rotation. The Crypto Fear & Greed Index remains elevated; by mid-July, investor mood was clearly optimistic and FOMO pressure was building. Throughout July, the index repeatedly printed above 70 (Greed).

Source: https://www.coinglass.com/pro/i/FearGreedIndex
Public attention, however, still lags price action. Google Trends shows that even with Bitcoin at all-time highs, search interest remains well below the retail frenzy peaks of 2017 and 2021. This suggests that, while large capital has moved, mass-market retail participation is still in an early build phase.
Discussion levels for altcoins on X (Twitter) are picking up but remain far from speculative blow-off territory. In short: strong FOMO signals are emerging, yet a layer of caution persists. Search data hint retail mindshare is gradually shifting from “Bitcoin only” toward a broader altcoin watchlist.

Source: https://trends.google.com/trends/
VI. Hot & High‑Potential Altcoin Sectors Snapshot
- Meme Coins: CoinGecko data puts aggregate meme-coin market cap at ~$78.9B, with a ~25% 7-day average gain. Leaders: DOGE, SHIB, PEPE, BONK, TRUMP, PUMP, PENGU, etc. Legacy dog/cat and frog memes have deep communities; newer names (TRUMP, PENGU, USELESS) lean on celebrity tie-ins, NFT/IP hooks, and Launchpad distribution. Highly cyclical, high-beta, narrative-driven — use tight risk controls.
- Emerging Layer 1s: Watch performance and scaling roadmaps for Solana, BNB, Hyperliquid, and incentive pushes from Sui, Berachain, Sonic, and other newer L1s. Upgrades in throughput, security, and ecosystem funding remain key drivers. Structurally important, but re-rating tends to be medium-cycle rather than pure momentum.
- Layer 2 Ecosystems: The Ethereum scaling trade. Benchmarks include Mantle, Arbitrum, Polygon, Stacks, Optimism, Immutable X, Starknet, zkSync, etc. Catalysts: sequencer revenue, incentive programs, cross-rollup interoperability. If “interoperability + airdrop rotation” continues to fire, L2s should stay in focus — though saturation risk rises as the field crowds.
- LSD / Restaking: The ETH rebound has re-ignited liquid staking and restaking narratives. Key tokens: LDO, EIGEN, BABY, ETHFI, among others. Drivers include protocol expansion (Lido upgrades), restaking primitives (EigenLayer), and yield structuring (Pendle V2, TradFi integrations). Deeply tied to Ethereum PoS economics; strong structural bid.
- RWA (Tokenized Real-World Assets): Institutional attention is climbing. Projects include Ondo, Centrifuge (CFG), Goldfinch (GFI), TrueFi (TRU), Maker (MKR), Reserve Rights (RSR). Ondo’s U.S. Treasuries pools (OUSG/USDY) total ~$1.4B TVL; Pantera has launched a $250M RWA fund with ecosystem ties. Regulatory clarity and yield spread vs. TradFi deposits underpin the thesis. Likely to remain an institutional magnet.
- AI: The narrative aligns with the global generative-AI boom. Watch ICP, FET, VIRTUAL, and broader AI infra names. Technical rebounds are underway; Google search interest in “AI Agents” is up ~320% YoY, fueling token mindshare. Capital tends to chase headline partnerships between AI leaders and crypto infra. Sustained app adoption = upside torque.
VII. Conclusions & Recommendations
Taken together, current signals suggest the crypto market is transitioning from a Bitcoin-led phase toward an early altcoin rotation. External tailwinds — policy easing, friendlier regulation, and institutional accumulation — form a strong macro base. Sentiment gauges sit in Greed; ETH/BTC has outperformed; a growing share of major alts have recently outpaced BTC; DeFi TVL, stablecoin float, and on-chain usage are all trending higher — evidence that allocators are warming to risk beyond Bitcoin.
That said, BTC dominance remains elevated, ETH/BTC has yet to break through key resistance, and flow patterns are still selective rather than broad-based. This landscape suggests we are in the early, uneven build-out phase of a potential Altseason — not yet the indiscriminate everything-pumps climax of prior cycles.
Forward View: If monetary easing and institutional inflows persist and macro stays cooperative, crypto’s broader bull cycle likely extends into H2 2025. The data mosaic shows credible “Altseason loading” signals — but confirmation still requires deeper rotation (falling BTC.D, sustained ETH/BTC breakout, wider breadth).
Positioning Guidance:
- Accumulate fundamentally strong alt assets selectively; scale exposure rather than chase vertical moves.
- Monitor key triggers (BTC.D breakdown, ETH/BTC > key resistance, rising breadth in Altcoin Season Index).
- Respect sentiment extremes — harvest gains into euphoric spikes.
- Maintain diversification and dynamic sizing; manage downside with staged stops and stablecoin buffers during volatility.
- Stay flexible, data-driven, and risk-aware to capture upside while avoiding the traps that often follow the first wave of altcoin excitement.
About Us
Hotcoin Research is your trusted source for professional crypto insights and strategic analysis. Our three-pillar framework — trend analysis, value discovery, and real-time tracking — integrates deep research, multi-angle project evaluation, and continuous market monitoring.
We deliver timely, actionable insights tailored to investors of all levels through our biweekly Hot Coin Selection Live Strategy Sessions and daily Blockchain Headlines.
Backed by advanced analytics and a robust industry network, we equip newcomers with foundational knowledge and support institutional players in identifying high-potential opportunities. At Hotcoin Research, we help you stay ahead in the fast-evolving world of Web3, turning data into confident decisions.
Risk Disclaimer
The cryptocurrency market is highly volatile and subject to rapid changes. All investments carry risk. We strongly encourage investors to stay informed, assess market dynamics carefully, and implement sound risk management strategies to protect their assets.
Connect with Us
🌐 Website: https://lite.hotcoingex.cc/r/Hotcoinresearch
📩 Email: labs@hotcoin.com
【免责声明】市场有风险,投资需谨慎。本文不构成投资建议,用户应考虑本文中的任何意见、观点或结论是否符合其特定状况。据此投资,责任自负。